01 / The situation
Distributed work made a local coordination tool hard to share.
Engineering teams used visual-management boards during daily standups to understand work waiting to begin, work in progress, changing priorities, status, and workload. Different groups developed different approaches: physical whiteboards, Jira, Microsoft tools, and, in some cases, webcams aimed at a board for colleagues elsewhere.
The problem was not simply “we need Kanban software.” It was preserving shared visual understanding across distance without discarding the practices teams depended on.
02 / Discovery and product decision
Custom enough to fit the work. Shared enough to reduce fragmentation.
I participated heavily in interviews, stakeholder conversations, synthesis, personas, journeys, pain-point analysis, desired behavior, MVP scope, and validation with users and leadership.
The product had to work across multiple engineering groups without becoming another generic Jira clone. The team built a browser-based visual-management system around TechnipFMC’s engineering practices and connected it to Oracle Primavera P6—the scheduling environment owned by the planning organization.
03 / My role
Designing across users, leadership, and implementation.
My work spanned research and synthesis, personas and journeys, product and interface design, Sketch prototypes, leadership presentations, stakeholder validation, MVP and feature discussions, collaboration with product management and engineering, and relationship-building with engineering managers.
I also contributed to the React front end, supported launch, and stayed involved as real use revealed where the system needed to change.
04 / What we built
Visibility beyond one team’s board.
Distributed teams could access current board information from a browser at any time. Subtasks could relate across boards, helping people answer not only “What is my team doing?” but “How does our work relate to another team’s work?”
Engineering teams were the day-to-day beneficiaries of the boards. Planning sat between those groups and needed to synchronize work across them. DVMB helped planning coordinate that work and made it easier for engineering teams to organize with one another—reducing the coordination burden that had fallen on planning.
That mattered especially because planning owned Oracle Primavera P6 and built the schedules there. Getting what lived in P6 to synchronize into engineering’s Kanban-style boards was a major win for planning: schedule intent and visual engineering work stayed connected instead of living in separate tools.
A quieter third population also benefited. Drafters received drafting tasks from engineering for work engineers were creating, and often had to coordinate across multiple teams. The boards made drafting workload easier to see, so an engineering team could understand current demand on drafting and be more realistic when every request could not be the top priority.
The system was adopted across engineering organizations in the United States, Brazil, India, Singapore, Scotland, and Norway, at a scale I remember being in the hundreds of users. An exact count is not available.
The interface below uses demonstration data. Labels and task names are not shown as live production project content.
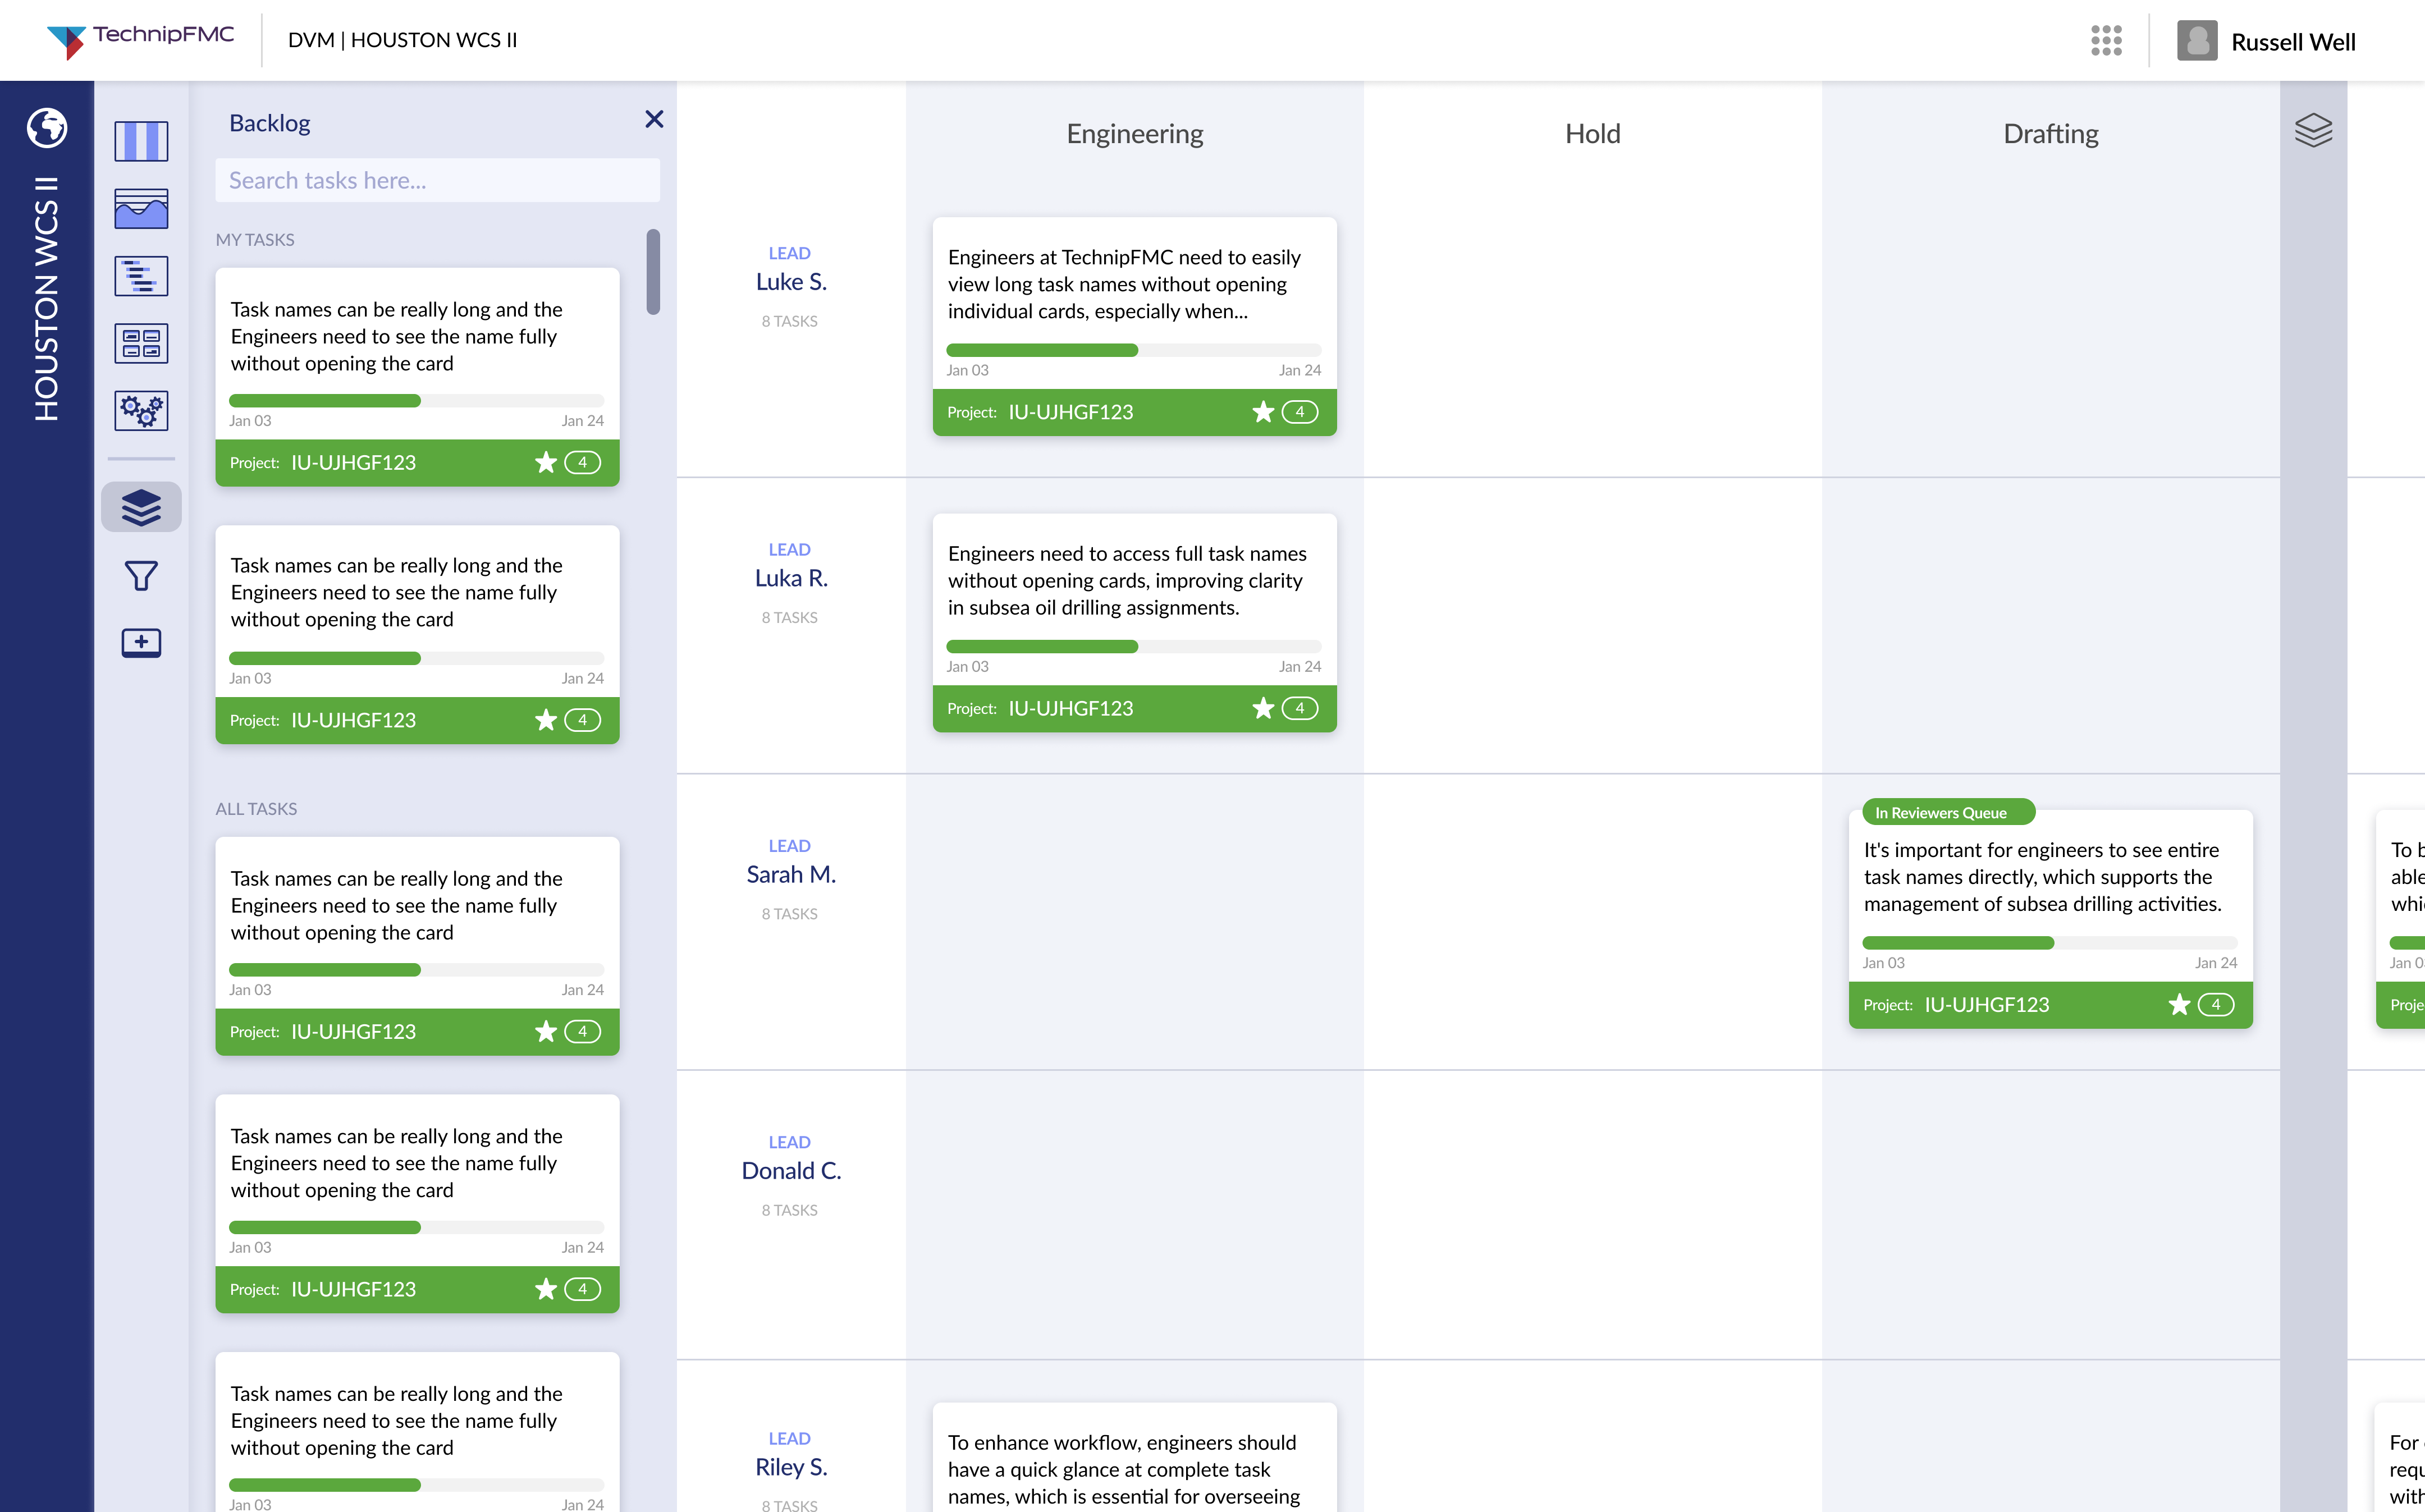
The board organizes work by lead and stage—including Engineering, Hold, and Drafting—while a backlog keeps tasks searchable beside the grid. Demonstration data is shown; production project content is not.
 View full-size image ↗
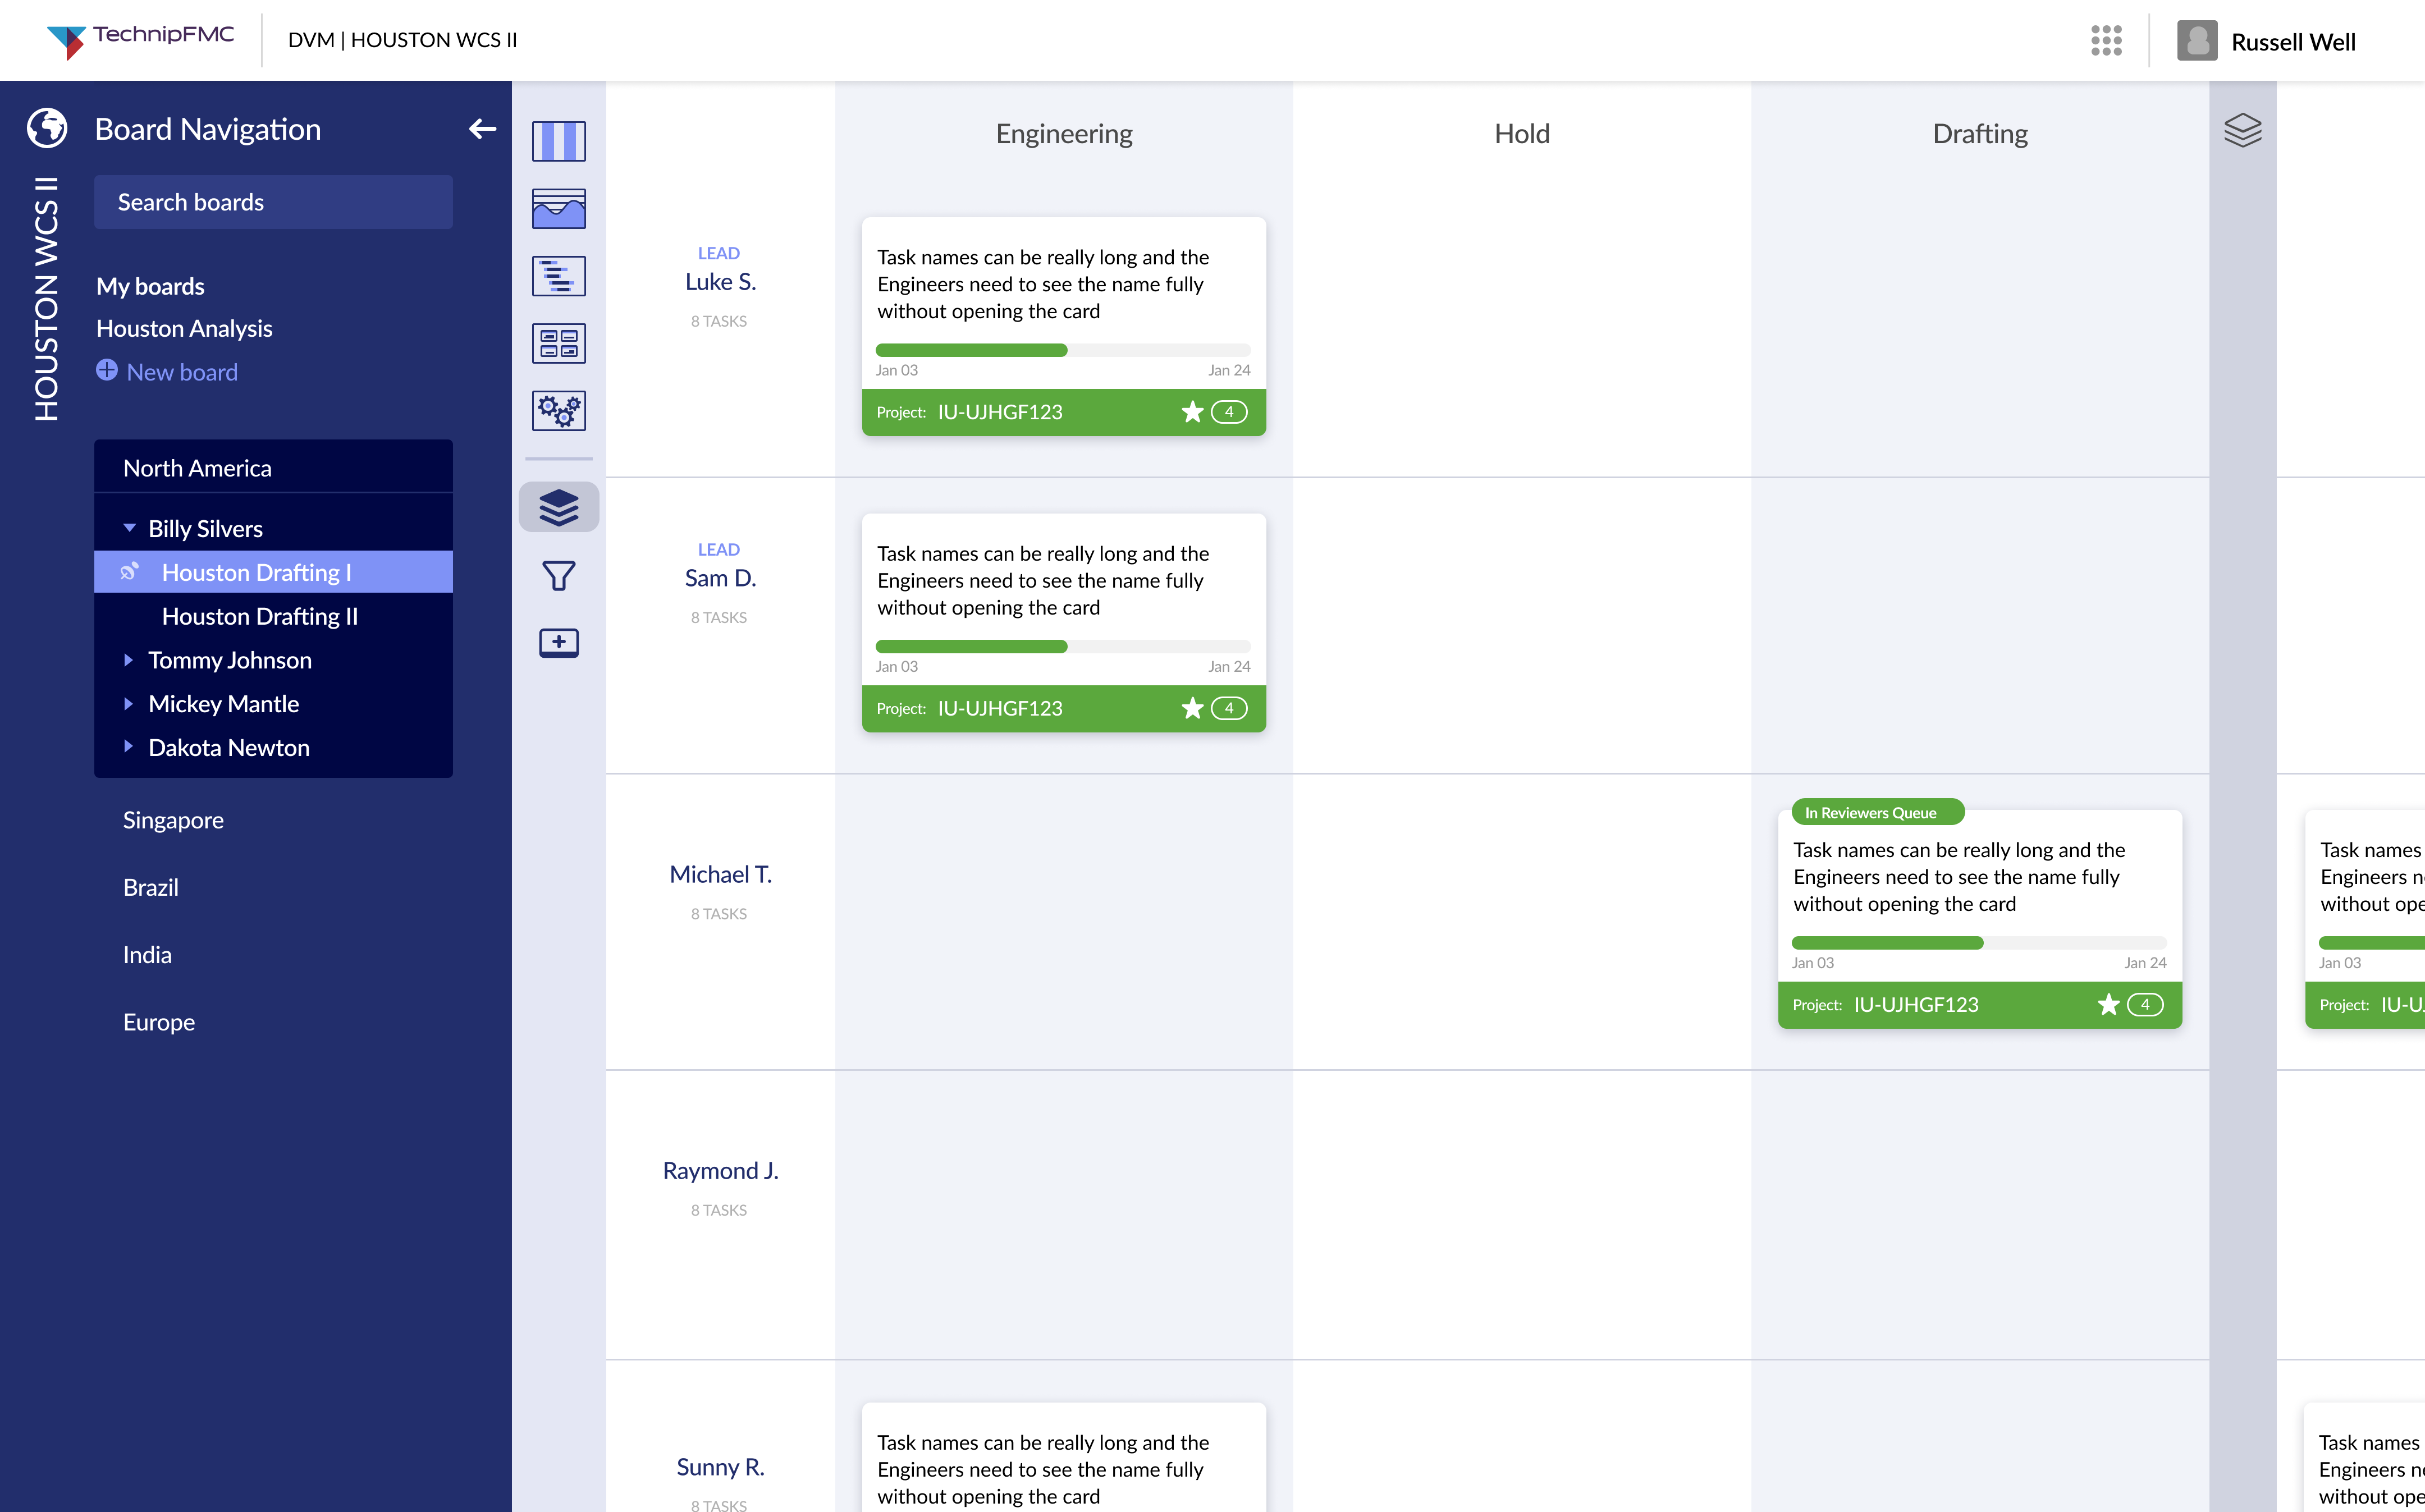
Board navigation grouped boards by region and team so planning and engineering leads could open the right board instead of reconstructing work across disconnected tools. Demonstration labels are shown.
 View full-size image ↗
05 / Learning after launch
A prototype can look resolved and still contain assumptions that only become visible in use.
The initial status system relied heavily on red, yellow, and green. Real-world use exposed that some engineers with color-vision deficiencies could not reliably distinguish the states.
Color carried the meaning.
Iconography reinforced each state.
We revised the product instead of hiding the mistake. The outcome was a persistent browser-based environment with greater visibility, cross-team awareness, and less fragmentation than participating teams’ previous collection of boards, webcams, and generic tools—especially for planning, engineering, and drafting groups that had to stay synchronized.